
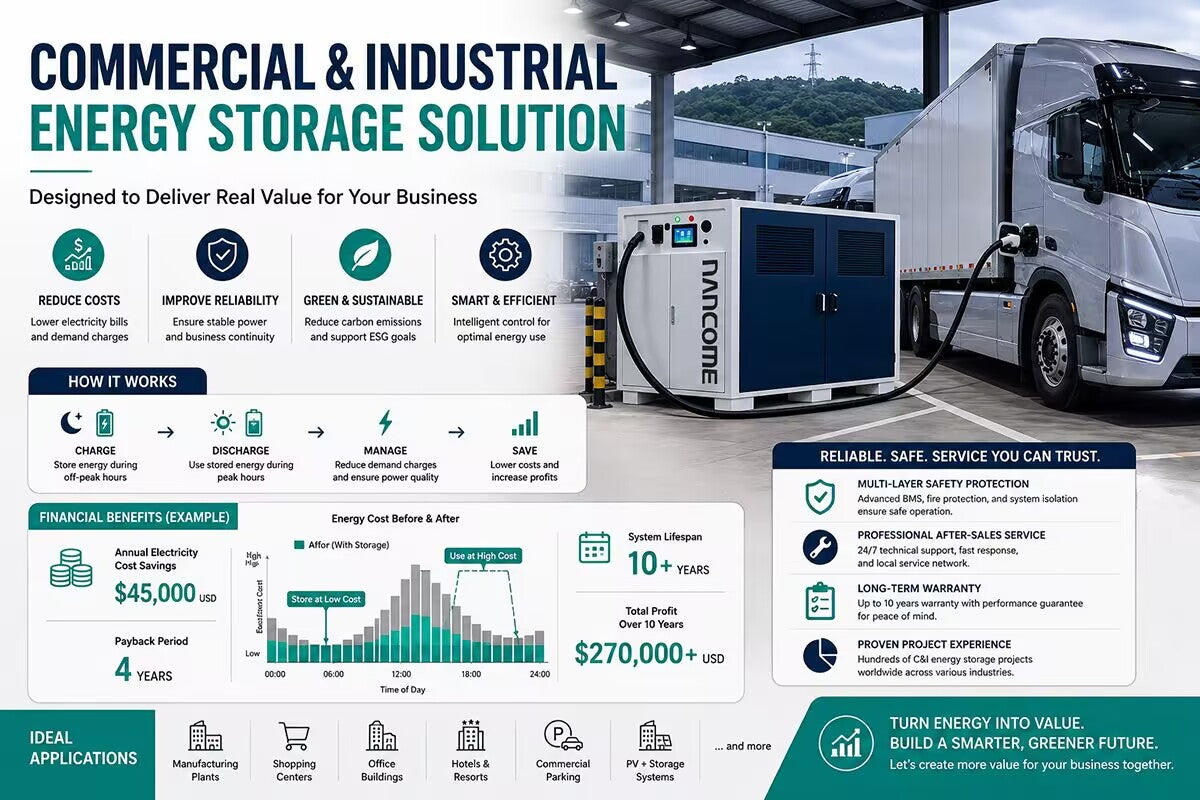
From the perspective of a solution engineer, the key is to transform cold technical parameters into tangible value that customers can truly understand.
Last year, I visited a customer with our sales team.
The customer was the owner of a local medium-sized manufacturing company, and he personally received us.
After opening the PPT, my colleague started explaining: battery cell energy density, PCS (Power Conversion System) efficiency, BMS (Battery Management System) architecture, system cycle life...
Halfway through the presentation, the owner interrupted:
“I don’t really understand all these technical parameters. I just want to know: after installing this thing in my factory, how much money can it actually save me? How long will it take to recover the investment?”
My colleague was left speechless.
I took over and said:
“Your electricity price is lower from midnight to 8 a.m. every day, but the factory does not consume much power during that period. During daytime peak hours, electricity prices are much higher. An energy storage system is like a ‘power reservoir’ for your factory. It stores electricity when prices are low at night and releases it when electricity costs are higher during the day.”
“Based on your electricity consumption pattern, our calculation shows that the system can save approximately RMB 450,000 in electricity costs annually, with a payback period* of four years. The equipment can operate for 10 years, meaning the remaining six years will generate pure returns.”
The owner’s eyes lit up:
“Now that makes sense. Keep going.”
After that meeting, I kept thinking:
The value of a solution engineer is not simply memorizing technical specifications. It is about translating technology into language customers can understand and transforming “products” into “value”.
Today, I will share how a solution that makes customers say “Wow” is designed.
01 Understanding Customers: Beyond Technical Parameters, What Do They Really Need?
Every time I discuss a project, I ask myself one question: What exactly is the customer paying for?
It is not the battery, not the PCS (Power Conversion System), and not the container — what they are buying is “certainty”.
Specifically, customers are looking for certainty in four key areas:
First, certainty of investment returns.
“I’m investing this money. How many years will it take to recover my investment? How much can I earn over 10 years? How high are the risks?”
The solution needs to answer:
How are the benefits calculated?
How are the parameters selected?
What happens under the worst-case scenario?
Second, certainty of operational reliability.
“Will this system fail frequently? How long will repairs take if something goes wrong? Will it affect my production?”
The solution needs to explain:
The service life of core components;
The failure rate;
The speed of after-sales response.
Third, certainty of safety risks.
“Will this equipment catch fire? What happens if a fire occurs? Who will take responsibility?”
The solution needs to explain:
How many layers of safety protection are included;
How the fire protection system is configured;
Who provides the insurance coverage.
Fourth, certainty of worry-free operation.
“After installation, do I need to assign someone to monitor it? Is operation complicated? Who should I contact if problems occur?”
The solution needs to explain:
The level of automation;
Maintenance frequency;
Service response mechanisms.
In one sentence:
Customers are not buying equipment. They are buying peace of mind that “electricity costs can be reduced, production lines can remain stable, and someone will take care of problems when they occur.”
02 Solution Structure: What Sections Should an Excellent Solution Include?
A solution that makes customers say “Wow” usually contains four key modules:
Part One: Pain Point Analysis — Make Customers Feel “You Understand Me”
Do not start by introducing the product.
First, use one page to clearly visualize the customer’s pain points:
High electricity costs:
• Monthly electricity bill screenshots;
• Highlight peak-valley electricity price differences and excessive demand charges.
Unstable power consumption:
• Voltage fluctuation records;
• Trip frequency statistics.
Power outage losses:
• Estimated production losses;
• Equipment damage cases.
Environmental pressure:
• Carbon emission targets;
• Green electricity requirements.
Key point:
Pain point analysis should make customers feel: “This person is describing exactly my situation.”
Part Two: Solution Design — Translate Technology into Value
Do not simply list technical parameters. Explain the logic behind the solution:
“We analyzed your load curve and found that your factory has two major electricity consumption peaks every day...”
(With a load curve chart)
“Our solution is designed as follows: charge during low-price periods, discharge during peak-price periods, while helping you reduce peak power demand...”
(With a charging and discharging strategy chart)
“This system adopts liquid cooling technology. Compared with air cooling systems, it provides more uniform temperature control and longer service life...”
(With a comparison chart)
Key point:
Every sentence should answer the question: “What benefits does this bring to you?”
Part Three: Revenue Calculation — Let the Numbers Speak
This is the section customers care about most.
A revenue calculation should include:
• Itemized breakdown:
Clearly show the contributions of peak-valley arbitrage, demand management, and demand response respectively.
• Transparent parameters:
Explain: The peak-valley electricity price difference used in the calculation; The system efficiency assumption; How battery degradation rate is considered.
• Clear results: Present:
Payback period; Total 10-year revenue; Internal Rate of Return (IRR).
• Sensitivity analysis:
Evaluate both: Worst-case scenario (electricity price difference decreases by 20%); Best-case scenario (electricity price difference increases by 20%).
Key point:
Calculation data should remain conservative, and all commitments must be achievable.
Part Four: Service Guarantee — Give Customers Confidence
• Warranty terms:
Include capacity degradation curve, availability commitment, and compensation mechanisms.
• Operation and maintenance services:
Explain: Response time; Spare parts inventory location; Inspection frequency.
• Safety insurance:
Include: Fire protection configuration; Third-party inspection reports; Insurance solutions.
• Case studies:
Present successful projects from: The same industry; The same region.
Key point:
Make customers believe :“If problems occur, someone will take responsibility.”
03 Differentiated Design: Customized Solutions for Different Scenarios
A one-size-fits-all solution will only make customers feel:“You don’t understand me.”
Scenario One: Manufacturing Factory
Core requirements: Reduce electricity costs and ensure continuous production.
Key design points:
• Demand management is a priority — basic electricity charges account for a high proportion of factory electricity costs.
• Backup power function should be emphasized — production line downtime can cause significant losses.
• Harmonic mitigation may also be required — CNC equipment is sensitive to power quality.
Example communication:
“Your production line could lose at least RMB 200,000 every time it stops. Our system can achieve millisecond-level switching, so when the grid loses power, your production line will not even notice.”
Scenario Two: Commercial Parks / Office Buildings
Core requirements: Reduce electricity costs, improve green electricity utilization, and enhance brand image.
Key design points:
• Peak-valley arbitrage is the main value driver — commercial electricity price differences are significant.
• Solar PV paired with energy storage is an additional advantage — improving the proportion of green electricity usage.
• Appearance design should be attractive — commercial parks have higher requirements for visual appeal.
Example communication:
“After installing this system, your park can reduce carbon emissions by xx tons every year. Your tenants will see that this is a commercially responsible and environmentally conscious community.”
Scenario Three: Data Centers
Core requirements: Power quality, reliability, and space utilization.
Key design points:
• Response speed is critical — millisecond-level response is required.
• Backup power duration must be sufficient — covering the startup time of diesel generators.
• Compact space design — space is extremely valuable in data centers.
Example communication:
“AI workloads experience significant load fluctuations. Our energy storage system can respond within 20 milliseconds and smooth out more than 70% of load fluctuations, making the impact on the grid almost unnoticeable.”
Scenario Four: Mining Areas / Islands / Remote Regions
Core requirements: Power supply stability, unmanned operation, and spare parts accessibility.
Key design points:
• Grid-forming capability — enabling independent grid formation.
• Remote operation and maintenance — reducing the need for on-site personnel.
• Spare parts inventory — addressing challenges caused by inconvenient transportation.
Example communication:
“The mining area is 200 kilometers away from the nearest county, and the grid becomes unstable whenever strong winds occur. Our system can build its own power network, eliminating the need to start diesel generators.”
04 Visualization Techniques: Make Complex Solutions Easy to Understand
Even the best solution is meaningless if customers cannot understand it.
Technique One: Use Visuals Instead of Excessive Text
• Load curve chart: Demonstrate electricity consumption patterns, which is 100 times more intuitive than written descriptions.
• Charging and discharging strategy chart: Use different colors to indicate charging, discharging, and standby periods.
• Revenue structure chart: Use pie charts to show the proportion of different revenue sources.
• System topology diagram: Demonstrate how the energy storage system connects to the power distribution system.
Technique Two: Create Impact Through Comparisons
• “After installing energy storage, your electricity bill will look like this...”
(Show a comparison chart)
• “Other systems achieve 95% availability, while ours reaches 98%, generating an additional xx ten thousand RMB in annual revenue.”
• “Traditional solutions require xx square meters of space, while our solution only requires half.”
Technique Three: Use Animations to Demonstrate Operating Logic
Many solution engineers only use static PPT presentations, but a simple animation can help customers understand instantly:
• Animation demonstration:
Electricity flows into the energy storage system during low-price periods, the system discharges during peak periods, and seamless switching occurs when the grid loses power.
• Recommended tools:
PPT’s built-in animation functions are sufficient. Canva can also be used, while advanced users may use AE.
Technique Four: Write Titles in “Customer Language”
Translate technical titles into language customers can easily understand:
“System topology architecture diagram” → “How the energy storage system connects to your power distribution room”
“EMS energy management strategy” → “How the system automatically decides when to charge and when to discharge”
“PCS technical parameter table” → “Core component: Why we selected this inverter”
Final Thoughts: Three Mindsets for Creating Solutions That Make Customers Say “Wow”
Mindset One: Understand the Customer First, Then Design the Solution
Many solution engineers start by presenting a “standard solution”.
However, a solution that truly makes customers say “Wow” must be customized based on their actual pain points.
Spending one hour understanding the customer is more valuable than spending one day writing a solution.
Mindset Two: Translate Technology into Value
Customers do not care about battery cell energy density.
What they care about is: “How much money can I save every year?”
Customers do not care about PCS efficiency.
What they care about is: “Is the system reliable and stable?”
Every page of a PPT should answer one question:“What benefits does this bring to you?”
Mindset Three: Make Customers “Understand, Calculate, and Trust”
Understand: Use charts and visuals instead of excessive technical terminology.
Calculate: Make revenue calculations transparent and clearly explain all parameters.
Trust: Provide real case studies and specific service commitments.


Leave a comment
All comments are moderated before being published.
This site is protected by hCaptcha and the hCaptcha Privacy Policy and Terms of Service apply.