(TOU pricing • demand‑charge management • right‑sized ESS • operating playbook | one‑stop delivery)
Why Talk Tariffs Before Hardware?
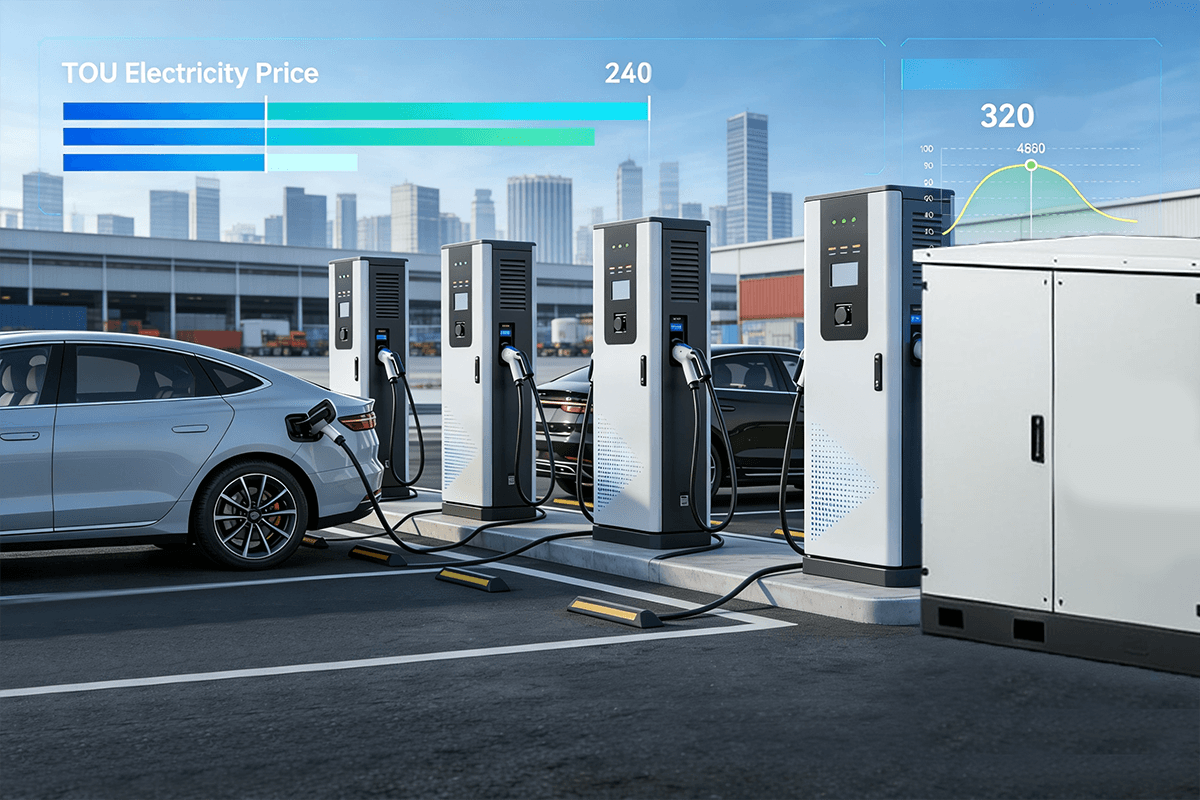
Cash flow and payback hinge on TOU pricing, demand charges, and behavior management—not just nameplate power. Learn more at AFDC: https://afdc.energy.gov/
We design a tariff‑aware operations plan using booking, queue logic, and incentives to lift utilization. This is more effective than oversizing hardware.
What We Deliver
Charging Station Solution chain: arrival modeling → TOU/demand‑charge simulation → peak‑shaving plan → pricing & booking → monthly reviews.
One‑stop stack: dual‑gun 180–240 kW as the main tier plus a few 320–480 kW liquid‑cooled bays, with an OCPP 1.6 backend for interoperability.
Customization covers local interconnect, taxes, and interface standards (CCS2 / GB/T), site layout, signage, and cable handling.
1) Sizing Principle: 80% Steady, 20% Sprint
Most 400 V trucks accept ~90–130 kW between 20–60% SOC, so an air‑cooled main tier is efficient and stable.
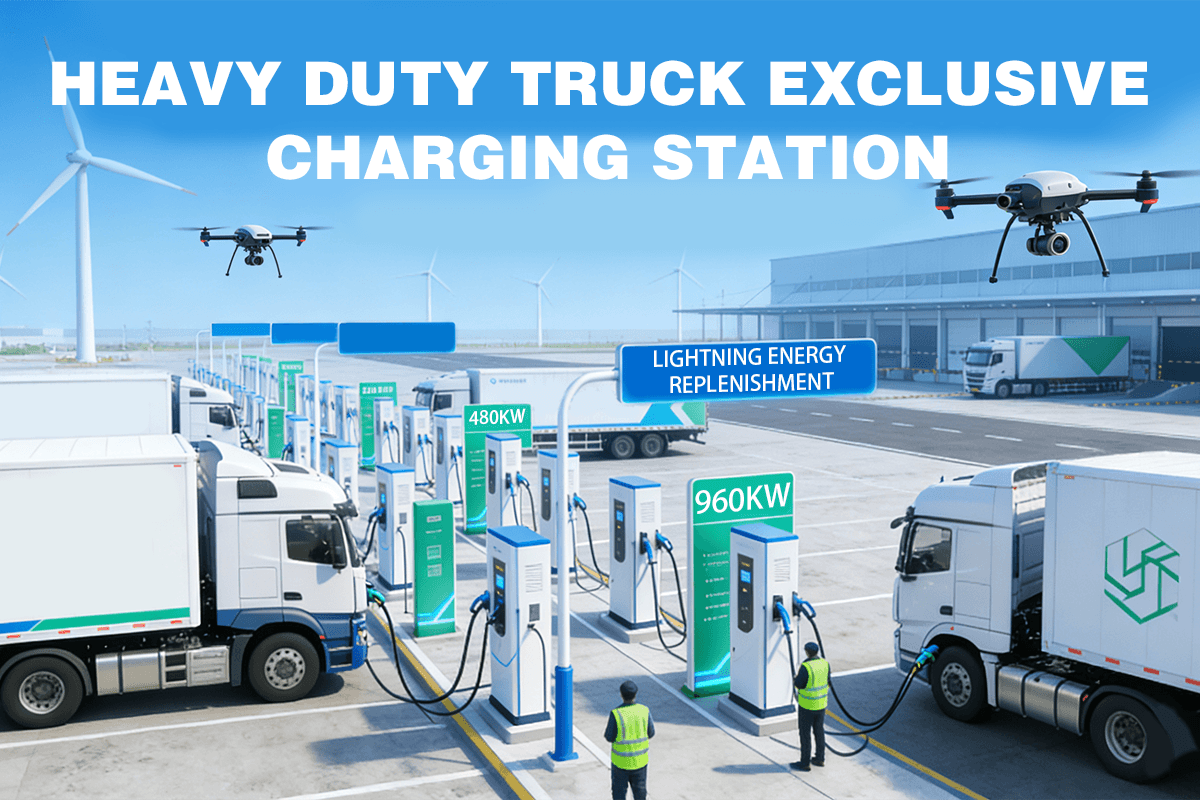
Use air‑cooled main bays and reserve liquid‑cooled bays for urgent jobs and high‑voltage models like heavy trucks: heavy‑duty truck charging.
2) Package: Equipment + Architecture + Backend
Hardware mix example: 12× dual‑gun 180–240 kW (main) + 4× dual‑gun 320–480 kW (peaks) → 32 guns for ≥40 vehicles/hour. Include truck cable management with booms and shade for uptime.
Backend features: EV charging reservation, billing/TOU, remote ops, alerts, and reports. Add charging KPI dashboard to track availability and throughput.
3) Four Steps to Lower the Power Bill
Step 1 — Quantify demand charges. Use a demand charge calculator and export peak windows from your CSMS.
Step 2 — Shift in time with a TOU pricing plan and soft caps on high‑power bays; prioritize short‑dwell sessions via booking.
Step 3 — Add ESS only if needed: peak‑shaving battery storage sized at 200–400 kWh to cover 15‑minute spikes.
Step 4 — Make data a habit: deploy a charging station KPI pack and review every 90 days.
4) Quick Example (Swap in Your Numbers)
Goal: ≥40 vehicles/hour; each from 25% → 70% SOC; average pack ≈280 kWh.
Energy/vehicle ≈126 kWh; at ~160 kW real power ≈47 min/vehicle; need ≈31.5 concurrent guns.
Suggested mix: dual‑gun 180–240 kW main bays + liquid‑cooled 320–480 kW peak bays. Tariff moves: EV fleet TOU rates, soft caps, and ESS for demand charges.
5) Why This Pencils Out
Energy cost: more kWh in shoulder windows. Demand charges: smoother curve, lower tiers. Concurrency: more medium‑power bays in parallel. Maintenance: localized faults. Future‑proof with OCPP 1.6 backend.
6) Pitfalls to Avoid
Chasing nameplate instead of the vehicle ceiling; using price alone without booking; assuming ESS fixes everything; ignoring the 15‑minute maximum.
7) Milestones
T‑0 to T‑30: strategy and specs, including EV charging pricing strategy. T‑31 to T‑60: integration and commissioning checklist. T‑61 to T‑90: trial ops and demand‑charge mitigation review. T‑91+: monthly KPIs and ROI check (build an EV charging ROI calculator for your CFO).
References (traceable)
AFDC — TOU & demand‑charge primers, deployment checklists: https://afdc.energy.gov/
Open Charge Alliance — OCPP 1.6: https://www.openchargealliance.org/protocols/ocpp-16/
NREL — Fleet electrification & site planning: https://www.nrel.gov/transportation/fleet-electrification.html
Оставить комментарий
Все комментарии перед публикацией проверяются.
Этот веб-сайт защищается hCaptcha. Применяются Политика конфиденциальности и Условия использования hCaptcha.